
Using microscopic techniques for ash deposit problems

Contents:
Introduction
Example 1- PC unit using Illinois Basin coal
Example 2- cyclone unit using Utah coal
Example 3- PC unit using PRB coal
Conclusion
Introduction
The use of microscopic methods for testing slag provides more data than standard test methods. Most test methods are for coal. They provide important information such as ash levels and chemistry, but may not provide the right data for slag deposits.
Slag forms when the low melting clays and rocks react to bond together the fly ash and other higher melting minerals, like sandstone. Microscopic tests, both light and electron (scanning electron microscope, SEM) provide information about the bonding material—the glue that holds the deposit together.
 The collected information determines how to change coal specifications or make operational changes that can reduce the slagging problems. Microscopic tests also work well with fouling, and other deposits found around the power plant. This paper describes how these tests work, along with some typical examples.
Sampling deposits
A good representative sample of slag is important for microscopic testing. Do not consider samples obtained from wheelbarrows in the basement as representative. The best way is to remove the samples directly from the boiler.
Document the size and location of the deposit with sketches or photographs. Try to get samples from the tube face and the surface of the deposit. A more detailed procedure for proper sampling of ash deposits is in the reference section of this paper1.
Initial inspection
The sample is first inspected to determine the type of material present. Is it glassy, gritty, brick like? What are the colors present? The physical appearance of a deposit offers clues to the type of material it is. The temperatures that the deposit formed under may also influence the appearance.
Tests for ash chemistry can provide additional data about the elements, and hence the minerals that may be causing the deposit to form. Black and brown materials often indicate iron rich slags. The black is reduced iron and the brown is oxidized iron. Samples that have been exposed to water can have the form of iron change from black to brown, which is another reason to use good fresh samples. The form of iron is important in understanding the combustion conditions during the formation of the deposit.
Deposits from the reheater, primary superheater and economizer are most likely fouling in nature. Fouling deposits are not molten like slag, but are held together by sodium and calcium sulfates. They generally appear brown to brick red in color.
Sample preparation
The types of microscopes and data you desire influence the sample preparation method. The simplest is to scrape some of the deposit onto a slide or SEM stud. Thin layer sections or polished sections are harder to make, but can reveal details not found in the simpler method. The nature of the deposit and the cost of the test determines the preparation method.
Optical microscopy
Optical microscopy using the polarizing light microscope (PLM) will provide several types of information. Glassy material and crystals are readily obvious. Glassy materials are not generally present in coal, and their presence in ash deposits is indicative of a high temperature environment.
Minerals such as quartz, anhydrite, and iron oxides are easily identified. PLM also allows the observer to use lower magnifications than the electron microscope. This allows you to see a "bigger picture" of the deposit. The use of PLM also allows you to see the internal structure of the deposit. This portion of the analyses will take only a few minutes, but you get a large amount of data.
Scanning electron microscopy
Scanning electron microscopes (SEM) allow the observer to look at the surface of the deposit under increased magnification. Light microscopy works well with magnifications of 40x to 400x. SEMs work well in the 200x to 5000x range with most samples.
The most useful feature of SEMs is that the electron beam produces X-rays that can identify the elements present. This feature is called energy dispersive X-ray analyses (EDAX) and is an important option for SEM analysis.
The combination of SEM and EDAX provides a tool to see what is holding the deposits together and to identify the elements that are holding it together. This information when combined with the PLM and the initial inspection, along with any standard testing results should give a clear understanding of the bonding mechanism.
Data interpretation
Experience in interpretation of microscopic data is critical. Many microscopists will be able to determine the bonding mechanism. In many cases, the resultant solutions may be obvious. In some cases, experience in coal quality, coal mining and coal geology are necessary. In others understanding of power plant operations and maintenance are required.
Ash deposits cause problems for many reasons. It is the combination of coal quality, plant design, and the operation and maintenance practices that all influence the formation of deposits. How solutions can be provided using these methods is best shown through examples. Several of these are shown below.
Example 1—PC unit using Illinois Basin Coal
The ash chemistry and the fusion temperatures of the coals looked similar. Samples of the slag were also analyzed using standard methods and still no explanation of the increase in slagging was readily apparent as the slag samples were similar to the coal analysis.
Initial inspection revealed that the samples were dark and glassy. One surface was in contact with the wall tubes, and the opposite side was exposed to the flame. Polarized light microscopy showed that the glassy structure was rich in iron and that there were fly ash like materials on the surface exposed to the flame.
There were two basic types of materials in the fly ash like material from the furnace side surface—particles rich in iron, and glassy aluminosilicates that were rich in potassium. These glassy potassium rich alunimosilicates were molten and bonding the iron rich particles together.
Potassium in coal is generally associated with clays. The presence of vast numbers of these potassium rich particles indicates a fuel with high clay content. Figure 1 shows this molten potassium rich material.
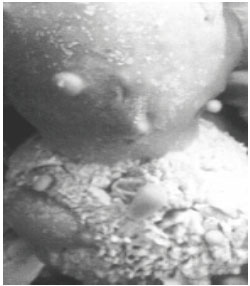
Upon reporting this data, the customer asked if pond fines would be high in clay content. Yes, the culprit was identified independent of fuel analyses. Pond fines being blended in with the coal were creating large amounts of molten glassy particles that were causing excessive slag.
Example 2—cyclone unit using Utah coal
Blue and green glassy slag samples from a B&W Cyclone type unit were tested to determine why the slag did not flow consistently. The samples appeared glassy and were homogeneous except for areas of blue color mixed in with the more common light green color. Thin layer sections of the deposit were made for both light and electron microscopy.
Examination of the slag with PLM indicated that the bulk of the material was glassy in nature. Large numbers of quartz particles were seen mixed into the glassy phases. Visual observation indicated that the quartz particles were dissolving into the glassy material.
The X-ray data from the SEM confirmed that the silicon from the quartz was dissolving into the glass. This dissolving of the silicon into the glass was raising the fusion temperatures or more importantly the viscosity of the molten glass. Figure 2 shows a quartz grain dissolving into the glassy material.
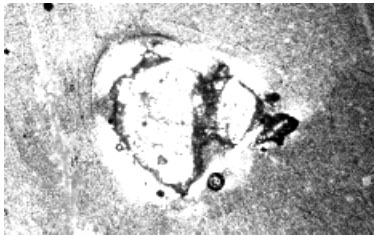
This information showed that an extraneous form of quartz was causing the viscosity or slag flow problems. In communications with the mine, it was determined that if less sandstone roof material (the source of the quartz) was mined with the coal that the problems could be minimized.
Example 3—PC unit using PRB coal
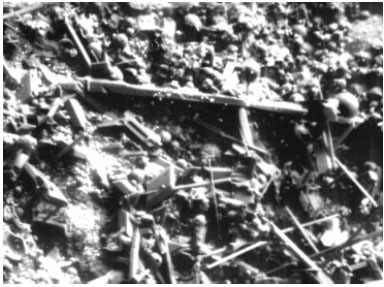
This sample consisted of a section of tube material coated with a hard brick like material. This material was from tan to reddish in color. Light microscopy revealed that the deposit was held together by anhydrite, a high temperature form of calcium sulfate. Electron Microscopy confirmed that the fly ash in the deposit was bonded together with calcium sulfate.
Calcium sulfate fouling deposits are believed to form from small grained or organically bound calcium in the coal. A program has been initiated to study the forms of calcium in the coal. This will help inimize the use of coals with high levels of organically bound calcium. Figure 3 shows crystals of CaSO4 bonding fly ash particles together.
Conclusion
This brief paper was designed to introduce the reader to the concepts of microscopic examination of ash deposits, and the useful type of information to be gained by using them. These techniques reveal the internal structure of a deposit and allow for the determination of the bonding mechanism. By identifying what is holding a deposit together, actions to correct the situation can be started.
References
1. Hatt, R.M. and Rimmer, S.M. "Classification and Sampling of Deposits from Coal-Fired Boilers," Journal of Coal Quality, April 1989, Vol. 8, Number 2, pp. 40-44.
About the author: Hatt currently operates the Fuel Utilization Services section of Commercial Testing & Engineering. Located in Lexington, KY, Fuel Utilization specializes in helping customers understand the effects of coal quality on power plant performance and cost. Hatt teaches a one-day Coal Quality and Combustion class attended by hundreds of industry personnel over the last seven years. RodHatt@compuserve.com.
Subscribe to our free e-mail newsletter.
Click for a free Buyer's Guide listing.